|
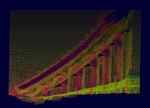
blue business graph
Graphical 3D for optical illusions from psdGraphics
|
blue_business_graph_1
3d metric re-visualisations show the numerical realities behind optical illusions
|
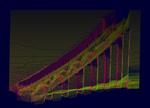
blue_business_graph_2
Changing numerical relationships for “seeing best perspectives” and measuring more details with higher precision
|
|
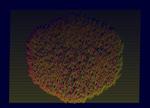
Epsilon15
A bacteriophage under a cryomicroscope from Nanowerk
|
Epsilon15_1
The light and colour values determined by the imaging technology are visualized “as is”
|
Epsilon15_2
As a result, new references can be built with specific parameter sets for calibration and comparisons
|
|
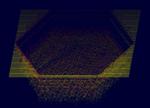
Nano comb
The 3D effect is created through light and darkness on Chemistry shapes the future
|
Nano comb_1
3d metric screens create a “visual 3D space”
|
Nano comb_2
3d metric re-visualizations reveal underlying structures in space and emerging patterns over time
|