Using Disruptive Mathematics as the Basis for Software Enhanced Intelligence
Three Methods to Assess Large Volume Data and the Challenges of Measurement
Executive Summary
The 21st century is heavily characterised by computer aided thinking. It thus allows us to make quantum leaps and paradigm shifts hitherto impossible. By building ‘smart web portals’ at nano-scale and below, as well as for telescopic distances, we can learn from the differences between images produced by light at different frequencies. The learning is encapsulated in numbers, as a new kind of ‘image metrics’.
CIOs (Chief Information Officers) and Chief Technology Officers (CTOs) may be failing to capitalise on the wealth of opportunity provided by the resource provided by the size and breadth of data sets. This paper describes the exceptional business potential from the application of new software methods which derive their value from processing vast numerical and image data. The methods are derived from mathematical insights which provide a fundamentally different approach. The prototype Visual Data Intelligence demonstrates the validity and commercial applications of these methods.
Understanding numbers is fundamental to data and this carries forward into the digital world. It is the root of this new intelligence which is best expressed in code. The profound appreciation of number theories, coming from a mature programmer, is at the heart of this prototype: unique and highly disruptive, rooted in good practice and using a foundation of pure science.
This allows an open avenue to a myriad of applications in ‘smart web portals’. They become smarter not only as more data is processed, but also as more and more expert users add value by their interpretations, which is particularly relevant in the medical field.
 |
 |
||
|
The blue dots are forecasting from the input data without knowing what kind of function it represents. Input can be any time series of multiple or complex applications, with flexibility over chosen time interval. The method will re-present numerical data in a way unique to each set. |
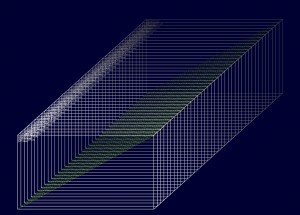
This screenshot shows 40 dimensions or vertical layers. The data points are straight lines illustrating ‘visual 3D’. More on Qualifying “3D”. This allows a perspective that is specific for each data set and brings with it a whole host of numerical analysis parameters. |
 |
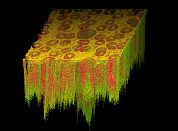
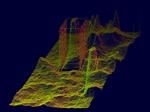
Supernova Cassiopeia. This re-visualization of the image on the left shows more depth and more detail than previously available. |
Visual and Metric Smartness in Web Portals
Whilst humans are good at seeing patterns, computers are good at processing these and the associated numerical data on a vast scale. Combining these strengths results in visual and metric smartness: quantifications are provided by the software and interpretations are contributed by the expert users. The result can then be turned into drop-down menus of options for less skilled operators.
This combined numerical intelligence is the basis for processing big data such that ‘data machinery’ can be operated for highest level decision support.
- Parallel layers provide a new visualization style for time series
- Concurrent projections can allow for short-, medium- and long-term trend identification. This has applications in many sectors, including financial markets and excitingly for climate change.
The methods give fresh insights, better identification of trends and through their capacity to analyse more events from historical and current data, allow for more accurate extrapolation for future behaviour.
- Vertical layers show interdependencies, e.g. for health data or business intelligence.
- New parameters can vary the visualization of interdependencies – potential applications could be cyber security or patterns of consumer behaviour, combined with financial data.
This identifies new interrelationships and dependences within complex data.
- Sophisticated numerical analysis allows for image selection based on complex criteria.
- New quantifications allow for measures that describe the qualities of the image objects, shapes and patterns thereof.
- Qualities of materials, processes or states can now be measured by combining the expertise of human visual appreciation with software smartness – at nano- and telescopic level!
This is enabled through greater in-depth and more detailed digital re-visualizations.
Applications
When asked by a medical institute to assess the likelihood of hairline cracks in specified positions on bone x-rays, we found this was a perfect application which utilised our image analysis method.
The re-visualization of images in the 3d metric way gives huge potential in the medical field. Professor David Wilkinson of University College London immediately saw what was going on and what the potential was for looking at stem cells using our re-visualizations.
 |
 |
Professor Dr. Pankaj Vadgama of Materials Research at Queen Mary’s University said “you are taking the noise out of data”, so excitingly!
This combination of pixel accuracy on screen and quantifications from numerical analysis takes uncertainty out of probabilities and reduces the preponderance of risk in the decision making process.
Prof. Dr. Miroslaw Malek, Chair of Computer Architecture and Communication at Humboldt University in Berlin, is my fan, stating that the re-visualizations are spectacular[1].
Richard Brook of E-Synergy saw that the technique behind our prototype was about the fundamentality of understanding number.
Algirdas Pakstas, professor at the Faculty of Computing in the London Metropolitan University has been invaluable in his support in developing and testing our theories and software applications.
Smart web portals are thus a new kind of artificial intelligence or expert system. As they learn not only from data but also from human expertise, for the purpose of mass operations and consumption at user levels of choice: executive, technical, educational, governmental or generally curious as lifelong learners.
To expand into a new paradigm of informed choice based on rigorous analytical assessment of what can sometimes seem overwhelmingly vast data sets is the real benefit.
Smart Web Portals as New Tools of Investigation
Using 3d metric software methods, one applies new tools to investigate past as well as present and future data. Assessing existing data adds to long term views and adds gravity to prediction and outcomes, by providing a resource to confirm and demonstrate the software’s increased accuracy.
I.e. seeing what was not visible before and measuring what was previously not measurable leads to the elimination of uncertainty and hence risk reduction.
Algorithms and numerical data challenge the definition of user interfaces for a variety of usage levels. This starts with expert users for representative reference data, leading to operator level for high throughput in real time:
- selection criteria for determining norms, variable extremes, derived standards and analysing systems and interpretations which learn from interaction
- support criteria for defining the bases for better informed decisions, metadata and parameter values that influence insights and increase understanding
- qualities requiring quantifications derived from colour and light in images which impact on fundamental assumptions (the physics of measuring and imaging).
 |
 |
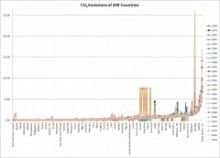
Excel: CO2 output of 209 countries |
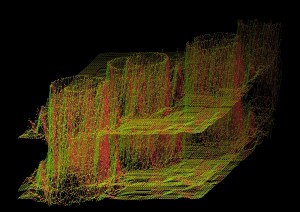
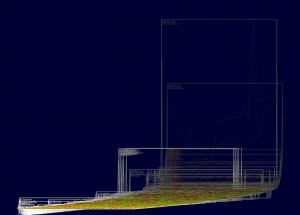
Visual Data Intelligence adds a new perspective with depth and the scope for many visualization parameters for more insights from the same data. |
Techniques to Tackle Time Series, Complex Data and Digital Images
- Processing big data and high throughput of images is made possible thanks to ‘numerical metadata’ as a ‘mathematical derivative’.
- Multi-dimensional data is visualized in more depth through ‘visual 3D’. This can be varied by many parameters influencing both numeric analysis and visual evaluation of time series, complex data and digital images.
- Digital images can be analysed individually and collectively. Re-visualizations make intellectual sense only individually and in small series. Based on small amounts of reference imagines, expert users will be able to populate vocabularies of objects, shapes and patterns, whilst software provides quantifications measuring regions of interest as well as images as a whole or in series.
- For financial markets, numerical data exists in time series. However, they also originate from sensors and other measuring instruments. The aim is to predict the future which has led to developing a forecasting mechanism with number of exciting parameters.
The 3d metric algorithms are unique in their fundamentally numerical approach. They have a whole host of ‘tweak parameters’ that are entirely different from all existing methods. Testing forecasts for a variety of financial data resulted in well above average results.
A portal focussing solely on financial data requires expert input as does a portal for climate data or in a medical arena of X-ray imaging focussing on hairline breaks. We are concentrating on providing software for experts with the built-in capability to disseminate the learnt knowledge from that process to provide an on-going benefit for society at large.
Time series cover many dimensions, parameters or variables in the domain of complex and vast data. The visualization of such data is a critical method that CIOs and CTOs should add to their existing analysis tools. For new vertical layers slice through complex data into visually interdependent patterns that the human eye grasps quickly, whilst the code offers quantifications contributing to the parameterisation of varied views and visualizations.
The first two of our methods can also be combined:
- To Forecast Short-, Medium- and Long-Term Time Series[2]
- The algorithm doesn’t fit to curves but to data trends
- Tweak parameters learn from data set to data set
- Trend periods are visually overlaid so that human experience can benefit from software smartness.
- To Layer Complex Data into Vertical Slices[3]
- Data science, dimensions, parameters and variables contribute to complexity
- The 3d metric approach distinguishes between
- dimensions which become vertical layers
- parameters that become user options
- and variables which vary visualizations.
- To Measure On-Screen by Quantifying Images with Pixel Accuracy[4]
- ‘Numerical metadata’ enables classifying, sorting and selecting images
- Reference images allow for calibrating the imaging technology as ‘benchmarks’, comparing images and their objects, shapes and patterns
- Comparisons in real time allow for improved quality control. This could be through a chip attached to a microscope, whether to spot mistakes in medical pills or the surface of car’s varnish.
Applications we are Developing
- a dashboard of business intelligence
- an add-on to SATURN – the Advanced Data Visualization for CyberSystems
- the Green Investment Bank solely dedicated to greening the economy, supported by the Labour Party Shadow Front Bench Business Team
- software lenses to zoom into microscopic worlds and investigate the qualities and behaviour of nanoparticles and quantum dots
- looking at the financial crisis data in a multi-dimensional way over short-, medium- and long-term time frames to predict and prevent future catastrophes
- Assessing the proliferation of bone mastitis, fractures from osteoporosis or improved identification of mutant cells.
Inspiration and Appreciation
To write a white paper was suggested to me at the Adaptive and Resilient Complex Systems Workshop (ARCS 2012)[5].
Lesley Kipling from Microsoft showed Did You Know? / Shift Happens[6] – a most impressive presentation illustrating the pace of change we are experiencing as a result of technology.


