My forecasting method is as much outside the box as my approach to data and images. It is characterised by:
- independence of scale and application, i.e. any data covering any time interval can be used
- the interval of the input data determines the interval of the output
- N input points produce N-1 output points.
The method does not ‘know’ whether the data is regular or irregular and thus does not try to fit a curve. However, since it does forecast regular data with 100% accuracy, the question is how well does it do for irregular and thus unpredictable data, such as financial data and data relating to climate change.
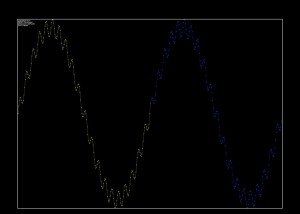
Yellow input data points produce blue forecasts.
For academics, who want to know how I’m doing it:
- since nobody paid me to develop my method, I want to turn it into money, rather than publish the knowhow.
For investors, who want to ask whether my IP is protected:
- I withdrew five patent applications, after an American IP lawyer advised me to protect myself with trade secrets, for patents are the game of the big boys.
For ‘strategic co-developers’, who want to create an expert portal that addresses to help you solve your problems:
- send me sample data and let’s talk
- the method can ‘learn’ from comparing past forecasts with past realities.
Next: Practical Applications.

