This project was a website on the server of the London Metropolitan University, until someone deleted it without checking.
I have now tried to bring it to new life through a Rapid Innovation Grant application by the Joint Information System Committee. But it appears as if the administration of the London Metropolitan University couldn’t cope.
The project is meant to use the multi-dimensional data visualization for economic and climate data.
Here is a 2-page summary.
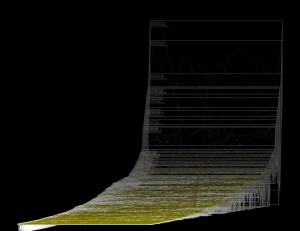
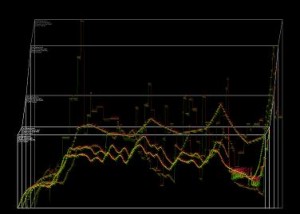
And here is a sample screenshot illustrating how CO2 emissions from 208 world regions can be compared thanks to our software.
Next: Investigating Materials or jump to my blog.


