Innovative Software – Using Disruptive Mathematics as the Basis for Software Enhanced Intelligence
Three Methods to Assess Large Volume Data and the Challenges of Measurement
 |
 |
 |
|
|
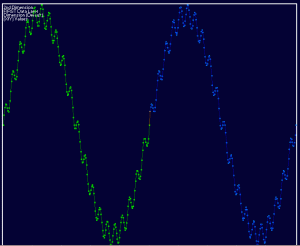
The blue dots are forecasts from the input data without knowing what kind of function it represents. Input can be any time series of multiple or complex applications, with flexibility over chosen time interval. The method will re-present numerical data in a way unique to each set. |
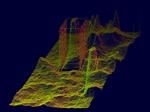
This screenshot shows 40 dimensions or vertical layers. The data points are straight lines illustrating ‘visual 3D’. |
 |
Supernova Cassiopeia. This re-visualization of the image on the left shows more depth and more detail – a first step for expert users, before automating high throughput. |
Visual and Metric Smartness in Web Portals
Computing power, to handle massive data, is now combined with the human ability to see patterns. This technology is highly disruptive: a combination of pixel accuracy and advances in powerful numerical analysis reduces uncertainties in visual and statistical outputs, resulting in reports for decision support.
Smart web portals using this newly combined power offer a special kind of artificial intelligence which learns from both data and human expertise. Benefits of this new technology are:
1. Interpretation and classification of massive amounts of data.
2. Forecasting of short, medium and long term trends.
3. Providing a better description and quantifications of the quality of products, materials and processes.
4. Seeing what was not previously visible and to measure what was previously immeasurable.
5. Taking fresh data directly from sensors: in production, quality analysis, research or anywhere else.
Examples of the new technology in action:
In PATHOLOGY: taking the noise out of data.
In ORTHOPAEDICS: predicting the probability of a hair line crack at a specified point on a bone X-ray.
In INSURANCE: combining climate data with insurance income and claims.
In FINANCE: comparing short-, medium and long-term trends of stock and other prices.
In BUSINESS: combining costs of actual clients with costs of potential clients, i.e. marketing channels.
