Re-Visualizing Images
The re-visualization of images is, potentially, not nearly as important as their quantification. For this quantification implies two levels of functionality:
- attributing unique classification values to an image as a whole
- analysing image components according to shape, object, pattern, colour and contrast.
The classification allows for sorting and ranking groups and galleries of images, so that particular ones can be selected according to numerical criteria.
The analysis of the image contents allows for associating numerical values to image descriptors in vocabularies and thus ways of comparing images according to their components.
The re- visualization
is important, for experts will spot more differences in our ‘visual 3D’ where a number of viewing parameters can be changed.
The quantification is important, for our ’software vision’ in ‘metric 3D’ allows for Automating Image Analysis, i.e. high throughput processing.

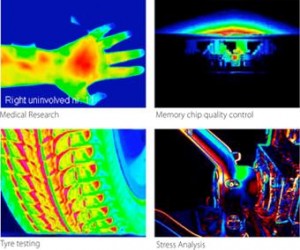
Infrared images from FLIR
I used these four images from the infrared and thermal imaging company FLIR to illustrate the innovations that my prototype software can offer.
Please click here to view 17 slides.
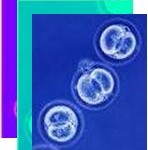
Another set of images came from IMAGEN-Biotech’s website.
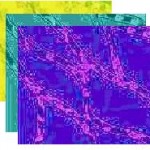
This is one of the seven images that is being re-visualized and viewed with different parameter settings.
The resulting 20 slides are here.
Next: Layering Complex Data or jump to my blog.


