 Three fundamentally different methods offer many opportunities for customisation and tailoring in virtually infinite areas of application:
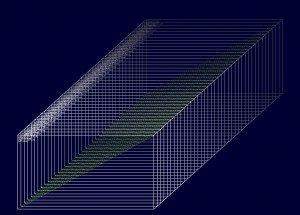
Layering Complex Data means visualizing multi-dimensional data along a “visual z-axis”. This axis is far from arbitrary. Neither is the size or the position of the layers. But “expert users” will blend the familiarity with their data with the “visual intelligence” that the software provides, so that less skilled users can benefit from automation and optimisation that only software can produce, not humans.
 Re-Visualizing Digital Images is based on analysing images by comparing them in a purely numerical fashion. The “re-visualization” serves mainly as ‘proof of concept’. Eventually, expert users will set values to parameters, so that less skilled users can benefit from human intelligence, combined with “software smartness”.
An image is input and processed such that a number of outputs can be delivered:
- a re-visualization for new insights into individual images
- new quantifications that measure qualities inherent in what the image represents – based on the interpretations by experts
- numerical metadata suitable for processing thousands of images for quality control and comparisons to find standards and references.
 Forecasting Time Series of any Interval is the innovative software algorithm based on re-visiting number theory, geometry and metrology with the eyes of a mature computer programmer.
This “outside the box” or “left field” approach is the strength regarding the potential of applications. The weakness is academic acceptance and thus funding.
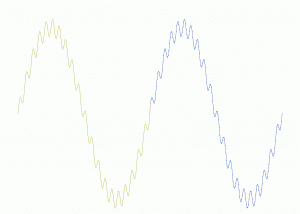
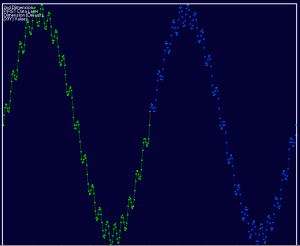
 This screenshot is only impressive, because the software has no idea what kind of function may be behind the data it is getting. The blue dots are the forecasts of the yellow dots that were input.
The white or black background are meant to illustrate the degree that our perception (or colour blindness) may play when seeing and interpreting data. The prototype is only meant to demonstrate the remarkability of the algorithms coded.
Here’s a summary on an A4-page for email purposes.
Next: Re-Visualizing Images.
